Tuesday, June 4, 2013

LoadRunner Certification

What is the requirement for LoadRunner v11 exam?

With LoadRunner v11, you would need to pass two core exams
  1. Exam HP0-M48: HP LoadRunner 11.x Software AND
  2. Exam HP0-M49: HP Virtual User Generator 11.x Software

What to expect in HP0-M48: HP LoadRunner 11.x Software exam?

  • Number of items: 67
  • Item types: multiple choice and drag-and-drop
  • Exam time: 105 minutes
  • Passing score: 72%

Syllabus

LoadRunner HP0-M48 Syllabus


What to expect in HP0-M49: HP Virtual User Generator 11.x Software exam?

  • Number of items: 63
  • Item types: multiple choice and drag-and-drop
  • Exam time: 105 minutes
  • Passing score: 74%

Syllabus

loadrunner HP0-M49 Syllabus

New features in LoadRunner 9.5

  1. LoadRunner noobs always struggle finding out the protocol behind a given application. It seems HP has noted the fact and have come out with a cool new feature called Protocol  Advisor. It sits inside VUGen. Protocol Advisor helps you to determine an appropriate protocol for recording a Vuser script. The Protocol Advisor scans your application for elements of different protocols and displays a list of the detected protocols. These protocols can provide a starting point for finding the optimal protocol for your application.

  1. Now you have the facility to export the Test Result from VUGen scripts to HTML and open Quality Center defects directly from the report.
    1. HP Service Test is now fully integrated with LoadRunner. You simply need to buy a license for service test to use its capabilities. [for the uninitiated, HP Service Test automates the testing process for services (SOA).
    2. LoadRunner 9.5 supports Windows Vista SP1. (LoadRunner 9.1 only supported generators while LR9.5 provides support for both generator as well as controller). To use LR9.5 on Vista, make sure that User Account Control (UAC) is enabled for users with User privileges.
    3. LoadRunner 9.5 provides support upto .NET Framework 3.5 version and supports .NET and Web Services protocols.
    4. LoadRunner is now integrated with a 3rd party software Shunra, to provide you access to WAN emulation. 
    5. Now you can define a Post Collate Command inside the Controller that it will run directly after it collates the results of a scenario run.
    6. LR controller has a new utility called Host Security Manager utility that will allow you to create secure communication channels between the LoadRunner Controller and load generators.
    7. There is a new Analysis API that will allow you to create an analysis session from test results, analyze raw results of an Analysis session, and extract key session measurements for external use.
    8. LR analysis now supports SQL Server 2005.
    9. LoadRunner 9.5 no longer supports Windows 2000.
    10. LR 9.5 is compatible with Quality Center(QC) 9.2, 10.0 and QTP 9.5 and 10.0 versions.

What is Paging?

Paging is one of the memory-management schemes by which a computer can store and retrieve data from secondary storage for use in main memory. In the paging memory-management scheme, the operating system retrieves data from secondary storage in same-size blocks called pages. The main advantage of paging over memory segmentation is that it allows the physical address space of a process to be noncontiguous. Before paging came into use, systems had to fit whole programs into storage contiguously, which caused various storage and fragmentation problems.

Paging is an important part of virtual memory implementation in most contemporary general-purpose operating systems, allowing them to use disk storage for data that does not fit into physical random-access memory (RAM).

What is Page Faults?

An interrupt that occurs when a program requests data that is not currently in real memory. The interrupt triggers the operating system to fetch the data from a virtual memory and load it into RAM.

An invalid page fault or page fault error occurs when the operating system cannot find the data in virtual memory. This usually happens when the virtual memory area, or the table that maps virtual addresses to real addresses, becomes corrupt.

MEMORY LEAK IN PERFORMANCE TESTING load runner

What is Memory leak:

 in computer science (or leakage, in this context), occurs when a computer program consumes memory but is unable to release it back to the operating system. A memory leak has symptoms similar to a number of other problems and generally can only be diagnosed by a programmer with access to the program source code; however, many people refer to any unwanted increase in memory usage as a memory leak, though this is not strictly accurate.

The memory for any consistent increase and also any degredation in CPU performance. Is it a memory leak?

Note that constantly increasing memory usage is not necessarily evidence of a memory leak. Some applications will store ever increasing amounts of information in memory (e.g. as a cache). If the cache can grow so large as to cause problems, this may be a programming or design error, but is not a memory leak as the information remains nominally in use. In other cases, programs may require an unreasonably large amount of memory because the programmer has assumed memory is always sufficient for a particular task; for example, a graphics file processor might start by reading the entire contents of an image file and storing it all into memory, something that is not viable where a very large image exceeds available memory.

To put it another way, a memory leak arises from a particular kind of programming error, and without access to the program code, someone seeing symptoms can only guess that there might be a memory leak. It would be better to use terms such as "constantly increasing memory use" where no such inside knowledge exists.

The term "memory leak" is evocative and non-programmers especially can become so attached to the term as to use it for completely unrelated memory issues such as buffer overrun.

Checking for Leaks:

There are a number of telltale signs that an application is leaking memory.
  • Maybe it's throwing an OutOfMemoryException.
  • Maybe its responsiveness is growing very sluggish because it started swapping virtual memory to disk.
  • Maybe memory use is gradually (or not so gradually) increasing in Task Manager.
When a memory leak is suspected, you must first determine what kind of memory is leaking, as that will allow you to focus your debugging efforts in the correct area.

Use PerfMon to examine the following performance counters for the application:

Process/Private Bytes:
The Process/Private Bytes counter reports all memory that is exclusively allocated for a process and can't be shared with other processes on the system.

Test: If Process/Private Bytes is increasing, but # Bytes in All Heaps remains stable, un managed memory is leaking.

 .NET CLR LocksAndThreads/# of current logical Threads:
The .NET CLR LocksAndThreads/# of current logical Threads counter reports the number of logical threads in an AppDomain.

Test:
If an application's logical thread count is increasing unexpectedly, thread stacks are leaking.

Test:
If both counters for 'logical thread count' and 'Private Bytes' are increasing, memory in the managed heaps is building up.

 .NET CLR Memory/# Bytes in All Heaps:
The .NET CLR Memory/# Bytes in All Heaps counter reports the combined total size of the Gen0, Gen1, Gen2, and large object heaps.

Test:
By default, the stack size on modern desktop and server versions of Windows? is 1MB. So if an application's Process/Private Bytes is periodically jumping in 1MB increments with a corresponding increase in .NET CLR LocksAndThreads/# of current logical Threads, a thread stack leak is very likely the culprit.

Test:
If total memory use is increasing, but counters for 'logical thread count' and 'Private Bytes' (measuring managed heap memory) are not increasing, there is a leak in the unmanag

Alternative method:
Start with monitoring the response times, throughput, total tps etc.. You should see the impact here if not monitoring the run time environment or system resources in first instance. Now it could or could not be memory leak.

Look at memory profile of the server hosting the run time environment and application server logs. Check the logs, if out of memory errors are recorded in the logs it could or could not be a memory leak. Check heap usage and gc logs. It could be a memory leak if the heap is full and no memory is being released after gc(s). If there is enough heap but jvm is still kicking off gc's to free the memory, the perm gen space might be full or could be some other reason.

If its a memor leak then jvm would be thrashing and hogging up all the cpu. You won't see any load on the down stream systems. Plotting graph from gc logs would show an increase in the heap troughs.
Above is just one example and there could be many many variations to this. You can simulate a memory leak yourself, just google it and you will find code to both induce and fix it.

As you might guess, memory leak, if left unattended and not corrected, could prove to be fatal. Memory leaks can be found out by running tests for long duration (say about an hour) and continuously checking memory usage.

Issues caused by memory leaks are essentially based on two variables for a standalone windows application
 1) Frequency of usage 
2) Size of memory leak.

 If either one or both are very high, the computer might come to a point when no memory is available for other applications. This could lead to a computer crash. If it is a network based application then you will also have to consider network traffic. If each network transaction causes a memory leak, then a high volume of network transactions could also prove dangerous.

LoadRunner Password Encoder and lr_decrypt()

If you ever need to disguise a password in a VuGen script, you will no doubt have used the lr_decrypt() function. If you have stopped to think for a second or two, you will have realised “encrypting” the password in your script doesn’t make it more secure in any meaningful way. Anyone with access to the script can decode the password with a single line of code:

// As a security measure, LoadRunner password encryption is about as effective as rot13.
lr_output_message("The secret password is: %s", lr_decrypt("50de7ec44d2ff7033c2fcb9e5cf7307799d7"))
So, if this feature doesn’t really make anything more secure, why was it included in LoadRunner? This is a classic example of a “pre-sales feature” – during the sales process, you just know that a potential customer is going to have an attack of “due dilligence” and say that everyone knows that passwords should not be stored in plaintext and they couldn’t possibly buy the product because it is so insecure. As a pre-sales engineer, you can say “it’s okay, all the passwords in the script are encrypted”, and the barrier to sale suddently disappears.

Encoding Passwords


There are several ways that a password string can be encrypted/encoded:
During recording, if the VuGen recording engine sees that you have made an HTTP POST request with a name/value pair called “password”, it will replace the password value with a call to lr_decrypt() when the script is generated.
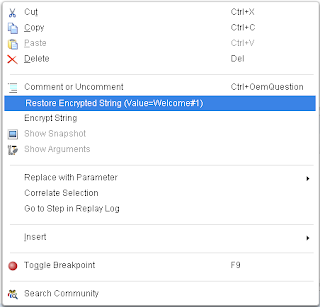
When editing your script in VuGen, you can right-click any string constant function argument and 

By using the Password Encoder, located under Start > Programs > HP > LoadRunner > Tools > Password Encoder
There is also a command line version of the Password Encoder, that can be found under LoadRunner\bin\PasswordEncoderConsole.exe. Note that the command line program can also be called from a LoadRunner script using popen() or invoked from a batch file if you need to encode a large number of passwords.

Decoding Passwords

An encoded password can be translated to plaintext in two ways:


  • By calling lr_decrypt() and using the plaintext string that is returned by the function. 
  • Recently added to VuGen (with the release of LoadRunner 11.50), is the ability to right-click on a call to lr_decrypt() in your script and select “Restore Encrypted String” from the context menu. 

Source Code Examples

If you want to have a play with with the LoadRunner encrypt/decrypt function directly (without using lr_decrypt()), you can do this by calling the vugen_crypt_encrypt() and vugen_crypt_decrypt() functions in VuGenCallback.dll.

// C example
Action()
{
    char* plaintext = "my secret password";
    char encryptedBuf[100];
    char decryptedBuf[100];
 
    lr_load_dll("C:\\Program Files\\HP\\LoadRunner\\bin\\VuGenCallback.dll");
 
    lr_output_message("plaintext: %s", plaintext);
    vugen_crypt_encrypt(plaintext, -1, encryptedBuf);
    lr_output_message("encrypted: %s", encryptedBuf);
    vugen_crypt_decrypt(encryptedBuf, decryptedBuf);
    lr_output_message("decrypted 1: %s", decryptedBuf);
    lr_output_message("decrypted 2: %s", lr_decrypt(encryptedBuf));
 
    return 0;
}
// C# example. Use the .NET vuser type to run this code.
namespace Script
{
    using System.Runtime.InteropServices; // DllImport
    using System.Text; // StringBuilder
 
    public partial class VuserClass
    {
        // Note: this program uses VuGenCallback.dll, which is also used by 
        // DecryptAddin (which gives the context menu encrypt/decrypt options in VuGen).
        // The PasswordEncoderConsole.exe and PasswordEncoder.exe programs use 
        // PwdEncoder.dll instead.
        // Note: do not add a reference to this DLL in the Runtime Settings, as it will
        // give a compilation error (due to a missing manifest).
        [DllImport(@"C:\Program Files\HP\LoadRunner\bin\VuGenCallback.dll")]
        private extern static int vugen_crypt_encrypt(string currentString, int miLen, [MarshalAs(UnmanagedType.LPStr), In, Out] StringBuilder encodedString);
        [DllImport(@"C:\Program Files\HP\LoadRunner\bin\VuGenCallback.dll")]
        private extern static int vugen_crypt_decrypt(string encodedString, [MarshalAs(UnmanagedType.LPStr), In, Out] StringBuilder decodedString);
 
        public int Action()
        {
            string plaintext = "my secret password";
            var encrypted = new StringBuilder();
            var decrypted = new StringBuilder();
 
            lr.output_message("plaintext: " + plaintext);
            VuserClass.vugen_crypt_encrypt(plaintext, -1, encrypted);
            lr.output_message("encrypted: " + encrypted);
            VuserClass.vugen_crypt_decrypt(encrypted.ToString(), decrypted);
            lr.output_message("decrypted 1: " + decrypted.ToString());
            lr.output_message("decrypted 2: " + lr.decrypt(encrypted.ToString()));
 
            return 0;
        }
    }
}

HP SiteScope Monitoring

HP SiteScope software monitors the availability and performance of distributed IT infrastructures including servers, operating systems, network and Internet services, applications and application components.

HP SiteScope continually monitors more than 75 types of IT infrastructure through Web‑based architecture that is lightweight and highly customizable. With HP SiteScope, you gain the real‑time information you need to verify infrastructure operations, stay apprised of problems, and solve bottlenecks before they become critical. HP SiteScope is an important component of both the HP Operations Center software and the HP Business Availability Center software, providing agentless availability and performance monitoring and management.

How HP SiteScope works 
HP SiteScope provides a centralized, scalable architecture.
HP SiteScope is implemented as a Java™ server application and runs on a single, central system as a daemon process.
HP SiteScope Java server supports three key functions: data collection, alerting, and reporting.
HP SiteScope enables system administrators to monitor your IT infrastructure remotely from a central installation without the need for agents on the monitored systems.
HP SiteScope accomplishes remote monitoring by logging into systems as a user from its central server, which can run on Windows®, UNIX®, and Linux® platforms.
HP SiteScope offers optional failover support to give you added redundancy and automatic failover protection in the event that an HP SiteScope server fails.

Advantages of HP SiteScope: 

Features an agentless, enterprise ready architecture that lowers Total Cost of Ownership
Monitors more than 75 different target types for critical health and performance characteristics
Generates daily, weekly, and monthly summaries of single and multiple monitor readings with built-in management server‑based reports
Serves as an integrated component of HP Operations Center and the monitoring foundation for HP Business Availability Center and HP LoadRunner
With HP Operations Manager, can deliver a combined agentless and agent-based monitoring
solution to deliver the breadth and depth you require
Gathers detailed performance data for IT infrastructure using agentless technology installed on your managed server or device
Enables the easy installation and monitoring of IT infrastructure monitoring in less than one hour
Reduces the time and cost of maintenance by consolidating all maintenance to one central server
Reduces the time to make administrative and configuration changes by providing templates and global change capabilities
Enables quick and efficient operations management with automated actions initiated upon monitor status change alerts
Offers solution templates that include specialized monitors, default metrics, proactive tests, and best practices
Supports easy customization to provide standard monitoring of previously unmanaged or hard-to-manage systems and devices

Monitoring system performance for an SAP application

Before performance testing a live application, we would first need to understand the performance goals and requirements. By obtaining and analyzing the existing performance metrics, we get a thorough idea on the system performance and this can be used for further benchmarking purpose. And these data are extremely important if an upgrade activity has been planned in the future with which the existing performance is to be compared with. Crystal clear SLAs are to be defined in the requirement gathering phase itself and this needs to be agreed upon by the stake holders. Given below is the standard procedure for extracting the relevant data to analyze and set up the performance SLAs for an existing SAP GUI system before any major upgrades.


CCMS Monitoring Architecture:
Extracting performance metrics and logs from an SAP System 

Getting the preliminary data for performance testing is relatively easy with SAP systems owing to the inbuilt capability and reporting facility that SAP comes with. Before deep diving into these features, it is important that we understand some frequently used SAP terminologies. For instance, we are aware that any live SAP system will have a central “Computing Center Management System (CCMS)” which can be used to monitor, analyze and distribute the workload of clients and to display the resource usage of system components. From CCMS it is possible to monitor a CPU host system, the DB, OS and SAP services, i.e. we can obtain CPU utilization rate, average workload for last few minutes and so on

There are several inbuilt monitors available with SAP: Workload monitor, Global work load monitor, Operating system monitors, Database monitors etc. To obtain statistical data for the ABAP kernel, workload monitor may be used (ST03) and global work load monitor (ST03G) may be used to display statistical records for entire landscapes (SAP R/3 and non-SAP R/3 systems).Database monitors are used to obtain the KPIs of the DB system. The SAP official documentation covers the configuration and utilization of these monitors 

For analyzing the performance of a system, it is good to start with workload monitoring, especially the Response Time Distribution. In the workload monitor, we have different views for workload analysis (check official documentation). Transaction ST03 will fire the workload monitor and we can select the particular instance and duration to which we need the response time distribution from the workload tree. The workload distribution is obtained by selecting “Response Time distribution” in analysis view type 

The output area contains three tab pages with the following characteristics:

  • In addition, workload monitor can be used to display the no of users working on an instance, workload distribution, transaction response time details and their memory utilization, spool requests volume and much more. If we are concerned about workload distribution amongst individual service types, we might need to use global workload monitor (ST03G) 
  • Operating system monitors and Database monitors are useful when analyzing the performance of the OS and DBs (alert monitor – RZ20 may be used for the same). Below is the standard monitoring architecture diagram 
  • Most commonly used SAPGUI monitor transactions are ST03N, OS-Monitoring ST06, buffer related Monitoring ST02, DB Monitoring (ST04), user distribution Monitoring (ST07)

Web Click and Script – Tips and Tricks

Overview of Web Click and Script Protocol

The Web Click and Script protocol is introduced in VuGen 8.1 FP2. The major advantage of the Web Click and Script protocol is that it supports client side JavaScript during replay. As a result, the need for correlation is drastically reduced and hence scripting time is reduced as well. It introduces a GUI-level scripting API, and an extremely quick way to generate load testing scripts. 

With Web (Click and Script) you will save valuable scripting time. The easy-to-use script eliminates the need for correlation. 

New intuitive API functions describe user actions on Web objects (button, text link etc.).
In tree view, the steps are grouped according to their pages.
In snapshot viewer, the object corresponding to the active step is highlighted.
Can create a Business Process Report (Microsoft Word format) summarizing the VuGen script. 

The LoadRunner QuickStart contains an appendix illustrating the new Web (Click and Script) features. Access the QuickStart from the Windows Start menu Mercury LoadRunner > QuickStart.

  • VuGen Version and Requirement
  • VuGen 8.1 FP2 and above
  • Supported browser: Only Internet Explorer 6
  • Supported Operating Systems: WinXP/2000/NT (not Win2003)
  • Recording Options

GUI Properties tab is related with the new features available in Web Click and Script.

Breakdown of Recording options available under GUI Properties -> Advanced

Enable out of context recording: VuGen does not natively support the recording of ActiveX controls and Java applets. You can instruct VuGen to create a URL-based script for ActiveX controls and Java applets, so that they will be replayed. Since these functions are not part of the native recording, they are referred to as out-of-context recording (enabled by default).

Record rendering: Record the values of the rendering-related properties of DOM objects (e.g. offsetTop), so that they can be used during replay. Note that this may significantly decrease the replay speed. (disabled by default).

Record `click’ by mouse events: Record mouse clicks by capturing mouse events instead of capturing the click () method. Enable when the recorded application uses the DOM click () method, which may result in generating multiple script functions for the same user action. (enabled by default)

Web Event Configuration: Changing the settings under this recording option will affect how sensitive VuGen is to capturing events when navigating a webpage. When moving the mouse over an image on a webpage, the web event configuration decides whether to record this as an event or to record an event only when a mouse click occurs.

Choosing the “High” Web Event configuration option slows down the recording and could also result in some events being captured twice. This setting should be used when events that are expected are not captured.

Choosing the “Basic” Web Event configuration option is the fastest. This setting should be used unless certain expected events are not captured.

For more detailed information on custom web event configuration, please click on the Help button on the Web Event Configuration box.

Best Practices
  • Use the mouse and not the keyboard as far as possible 
  • To capture events, work only on browser windows opened by VuGen 
  • Wait until the page loads completely before going on to the next step of the business process 
  • Always start recording on a new script. Do not record over an existing script 
  • Avoid using context menus i.e. menus which pop up when clicking an item in a GUI 
  • DO NOT reorder functions or move them from one section of the script to another
Limitations
  • Records and emulates on Internet Explorer version 6 only 
  • Does not support recoding on Windows 2003 
  • Does not support VBScript and Applets 
  • Does not support user actions on ActiveX objects and Macromedia Flash 
  • Supports only English language applications 
  • Scalability is lower than the Web HTML protocol 
  • Replay snapshots may differ slightly from the actual Web page 
  • Modal Dialogs are not supported 
The automatic generation of web_reg_find statements for page titles does not work in Web Click and Script. Workaround is to manually add the web_reg_find after the script has been recorded

Tips and Tricks

  • When the HTML contains code such as Offsettop or Offsetleft (which are properties used to give the coordinates of the element) : Enable record rendering related property values under Recording Options -> GUI Properties -> Advanced 
  • To record “mouse over”, “mouse down” events on a webpage : Change the Web Event Configuration to High under Recording Options -> GUI Properties -> Web Event Configuration 
  • If the script continually fails on a particular step: Try replacing that step with Alternative Navigation. Right click on that step and choose “Replace with alternative navigation” on the menu that comes up 
  • If a “Button Not Found” error is seen: Check to see if the value in the script is the same as that reported in the replay log. If not, replace the value in the script by that reported in the replay log

Difference between Web(Click & Script) and Web(HTTP/HTML) protocols in load runner

1) Difference between Web(Click & Script) and Web(HTTP/HTML)
These two are designed for recording web applications. The script generated will be different for each protocol. Click and Script recording resembles QTP script as it uses qtp engine.

2) Which one shoud we use?
If you want to mimic client side java script or applets loading time then click and script would be good otherwise http/html. In click and script there is no correlation.

3) In HTTP/HTML version, which option to select between HTML and URL when generating code?
If you select HTML mode, the script generated will be less compared to URL as URL mode generates one LR funtion for each link request. You can verify this by changing the mode and regnerating the script. If you select URL mode you will get a very detailed view of the application and script is large to maintain
And if there are frames in your web application, if one page is passing some info to others, in HTML you may miss. For some of the apps I have seen this kind of behaviour and forces you to choose URL option.

4) Will I see higher times with Click & Script?
Sometimes Yes. Because it will mimic client side javascript execution also
Loadrunner - Difference between Web(HTTP/HTML) and WEB,AJAX(Click & Script) protocol in terms of virtual user

Web (HTTP/HTML) protocol script consist of series of requests. Loadrunner start processing the requests one by one, once request is completed after receiving the response, it just forget what happened and proceed with the next request, so it consume less memory and don't process any web page code.

Where as click & script protocol virtual user is a hidden browser, it works similar to the real browser by executing the web page code, so correlation is not required . By using very limited object properties, HP could implement QTP technology into this protocol. User can also access page DOM using java script similar to .Object in QTP. Naturally it consume more memory and create more load on load injectors.

If the application is using heavy AJAX and third party controls, it may consume lot of memory and CPU usage. Always monitor load generator memory and CPU usage, it should not go beyond 80%. Some time Vusers run very slowly after couple of iterations, not meeting the script expectation.
In these situation, we do have following issues when virtual users are running as "thread".
Some of the virtual users may fail with the following error message
Action.c(360): Error: C interpreter run time error: Action.c (360):  Error -- memory violation : Exception ACCESS_VIOLATION received.
Function Specific error
Action.c(360): Notify: CCI trace: Action.c(360): web_browser(0x02081b03 "Java_Script", 0x0208214f "ACTION", 0x02081292 "EvalJavaScript=igtbl_getRowById('ctl00xc...", 0x02082111 "LAST")
In-order to overcome above error, run the virtual user as "process" instead of "thread", now virtual users are stable and each is assigned separate memory.
Loadrunner create virtual user using mmdrv.exe process, if virtual users are running as process, virtual user count and mmdrv.exe process in the task manager count will be same.
Install load injectors with Windows 2003 64bit to accommodate more memory.

Web (Click and Script) VuserWeb (HTTP/ HTML) Vuser
Emulation of communication between Browser and Web Server at user action levelEmulation of communication between Browser and Web Server.
The events will be captured at the browser page GUI elements levelThe events will be captured at the HTTP Protocol level on a specific browser
The scripts contain detailed information about the GUI eventsThe scripts contain detailed information about the recorded traffic.
Some of the common functions generated on different GUI objects are:
• web_browser (for invoking the URL)
• web_edit_field (to set the value to a edit box)
• web_image_submit (to click on a image button, which will send the data to the server)
• web_image_link (to click on a image link)
• web_list ( to select an item from a list)
• web_check_box (to set on or off on a check box)
• web_radio_group (to select an item from a radio group)
Some of the common functions generated at HTML based script
• web_url (Loads the specified Web page)
• web_submit_data (Performs an "unconditional" or "contextless" form submission)
• web_reg_save_param (Registers a request to save dynamic data information to a parameter)
Support non-HTML code such as Javascript on the client side. Do not support Applets or VB ScriptAs Web (HTTP/ HTML) records at the protocol level, it doesn’t have any client side scripting dependency. So, it supports all client side scripts
Accurately emulates user actions on the Web page (the way the user does step by step) and executes the necessary Javascript codeEmulates the page submissions and HTTP traffic. Doesn’t emulate user actions as you do step by step on the GUI pages.
For each user step on the GUI, an event or function will be captured on the Vuser scriptFor each page submission or server request an event or function will be generated
Most of the dynamic data (sessions, cookies, etc.) handled automatically. The reason, the script events are captured at the GUI level. Normally the session or cookie related issues will come when the complete page data is submitted on the serverAll the dynamic data needs to be handled by way of correlations
Provides three levels of recording:
• GUI Based script,
• HTML-based script
• and URL-based script
Provides Two levels of recording:
• HTML-based script
• and URL-based script
For most applications, including those with JavaScript, use Web (Click and Script) VusersFor browser applications with applets and VB Script or for non-browser applications, use the Web (HTTP/HTML) Vuser.
Allows user to generate detailed (event specific) Business Process Reports which summarize the script.Allows user to generate page specific Business Process Reports which summarize the script.