According to the Oracle doc hogging threads “.. will either be declared as stuck after the configured timeout or will return to the pool before that. The self-tuning mechanism will backfill if necessary.”
So how long does it take for them to become hogged? Nobody (including Google) seemed to know. Trust me I did some research and asked plenty of colleagues about this. Here is the answer:
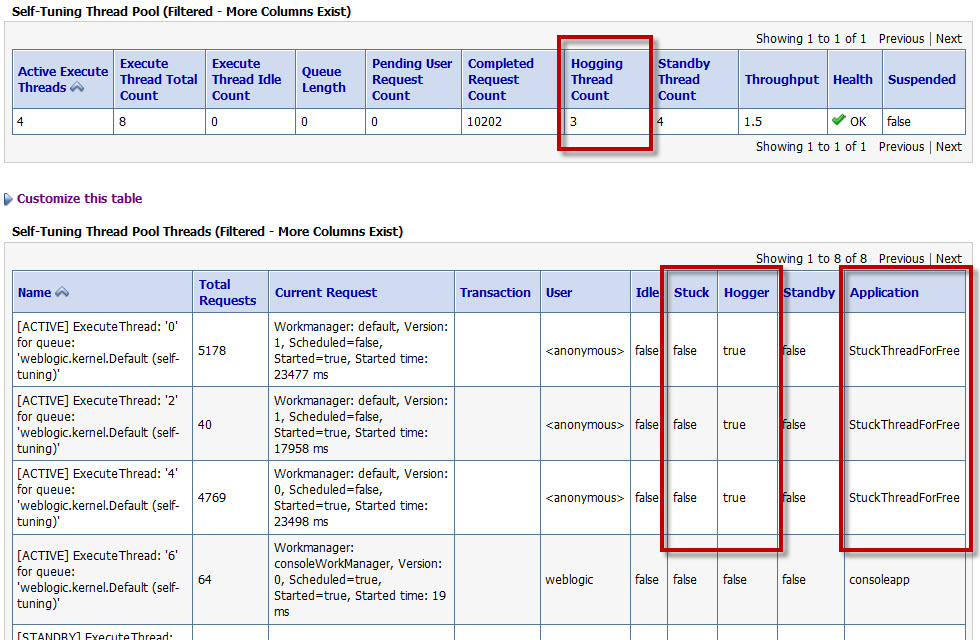
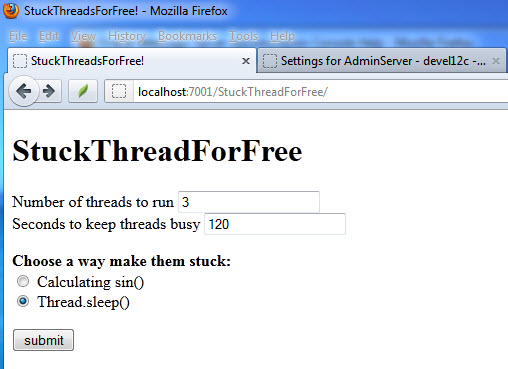
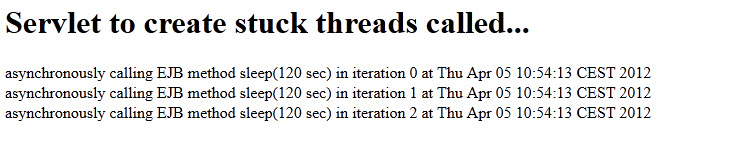
If you run the application with 3 threads / 100 seconds / Thread.sleep() and immediately switch to the WebLogic 12c admin console Admin Server / Monitoring / Threads you will observe the following:

So interestingly hogging threads are detected right away! In my case it took about 2 seconds (I had to hit reload once).
So WebLogic transitions into FAILED state when a certain number of stuck threads are detected, right?
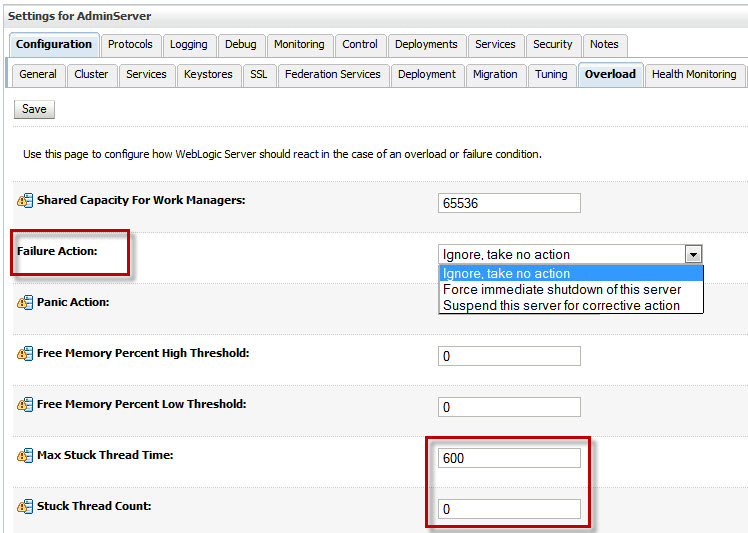
That’s a common misconception! The default configuration of WLS 12c (I also checked for WLS 11 = 10.3.3) is Stuck Thread Count = 0, which means the server “never transitions into FAILED server irrespective of the number of stuck threads”. You will only see the FAILED state only when you set the value to a positive number of threads!
Once the server transitions into FAILED, you can define if WLS should be shut down (and restarted by WLS nodemanager) or suspended.

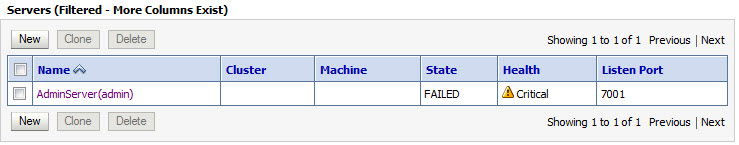
Remember: WLS will not transition into FAILED state when StuckThreadCount is set to zero. Only the health runtime value is set to Warning (but this will be cleared if the hogging thread conditions clears) as shown below:

What exactly causes a stuck thread? What state does a thread have to be in to be marked as stuck?
In general there is a number of different
thread states in Java:
NEW,
RUNNABLE,
BLOCKED,
WAITING,
TIMED_WAITING,
TERMINATED.
But which state has a thread to be in to be marked as stuck later? If you run the StuckThreadForFree application and create a stack trace with WebLogic admin console under Server / ServerName / Monitoring / Threads you can observe that the thread state is ACTIVE/TIMED_WAITING when using the Thread.sleep() method to block it:
"[ACTIVE] ExecuteThread: '5' for queue: 'weblogic.kernel.Default (self-tuning)'" TIMED_WAITING
java.lang.Thread.sleep(Native Method)
com.munzandmore.stuckthread.LongRunningEJB.threadSleep(LongRunningEJB.java:26)
com.munzandmore.stuckthread.LongRunningEJB_x9v26k_NoIntfViewImpl.__WL_invoke(Unknown Source)
when using the calc() method to keep the threads busy they are state ACTIVE/RUNNABLE :"[ACTIVE] ExecuteThread: '0' for queue: 'weblogic.kernel.Default (self-tuning)'" RUNNABLE
com.munzandmore.stuckthread.LongRunningEJB.threadCalc(LongRunningEJB.java:40)
com.munzandmore.stuckthread.LongRunningEJB_x9v26k_NoIntfViewImpl.__WL_invoke(Unknown Source)
weblogic.ejb.container.internal.SessionLocalMethodInvoker.invoke(SessionLocalMethodInvoker.java:31)
So both states can become stuck. Also, I am pretty sure I could also show the BLOCKED state when using a monitor lock for synchronization but due to time restrictions this is not included in the app.
Can a stuck thread still do reasonable work?
Absolutely! Just because a thread is marked as stuck it doesn’t mean it is frozen or unusable. Imagine you wanted to calculate PI, you are creating PDFs, distance maps, mapping the human genome or you have deployed some JCA adapter talking to MQ-Series, SAP or PeopleSoft which is internally using a Thread.sleep() method call. All of this is are reasonable usages likely to occur in the wild.
Do stuck threads ever dissapear? Can they be cleared somehow? Are they stuck forever?
First of all you cannot get rid of a stuck thread by simply “killing it”. You cannot cancel or kill any thread in Java. However, stuck threads automatically will disappear if the condition clears up which caused them to be marked as stuck (e.g. the sleep period is over or the calculation is done).
To prove the point, switch to the WebLogic admin console and under Server / ServerName / Configuration setStuckThreadCount to 3 and StuckThreadTime to 60 seconds then restart the server and run the StuckThreadForFree app to create 3 threads running for 120 seconds using the Thread.sleep() method (the other method will work as well, there is no difference, but keeping 3 threads busy by doing math proves to be a fan test of your machine as well):


In the WebLogic log file you will find three entries logging the stuck thread state after a while:<05 .04.2012="" 10:55="" mesz="" uhr="">
<05 .04.2012="" 10:55="" mesz="" uhr=""> <[STUCK] ExecuteThread: '4' for queue: 'webl
ogic.kernel.Default (self-tuning)' has been busy for "85" seconds working on the request "Workmanager: default
, Version: 1, Scheduled=false, Started=true, Started time: 85443 ms
", which is more than the configured time (StuckThreadMaxTime) of "60" seconds. Stack trace:
java.lang.Thread.sleep(Native Method)
After waiting about one minute you will observe that WebLogic is transitioning into FAILED state as configured:

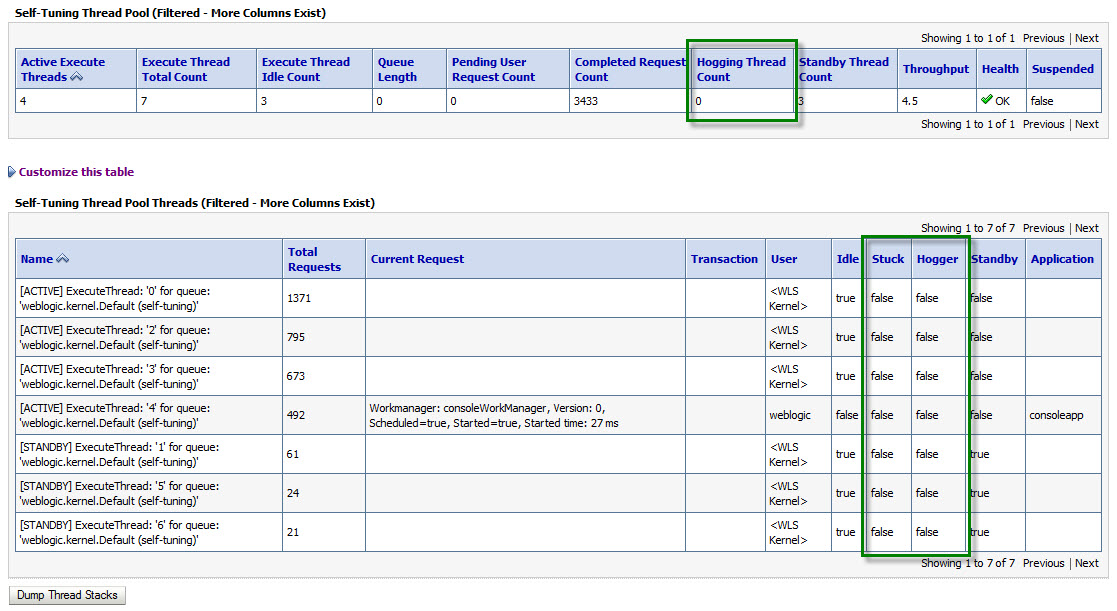
Wait another minute, then check the thread states under Server / ServerName / Monitoring / Threads which reveals the following:

So once the condition causing the stuck threads is cleared also the stuck threads will disappear again! Stuck threads are not stuck forever. Phew!
When should I use StuckThreadCount in the admin console or a Workmanager stuck-thread setting then?
Very good question. Use StuckThreadCount from the WebLogic admin console or with a definition moving the application into ADMIN mode if you can react on the FAILED state.
Do not use StuckThreadCount if the threads might be doing something useful and you cannot react on the situation anyway. Obviously transitioning into FAILED state and restarting WLS with the nodemanager is counterproductive if you threads are doing something useful.