Monday, December 9, 2013

Error: Extenstion lrcVba was not loaded. You are running under secure mode and this extension is not allowed-Error in loading Extension or DLLs while running LG over firewall

When running COM/DCOM scripts either from standalone Controller or from Performance Center, they fail with

"Error: Extenstion lrcVba was not loaded. You are running under secure mode and this extension is not allowed"
The same issue can happen for VB and JAVA user scripts.

To solve this follow these steps:

To be able to run the COM/DCOM scripts on an InjectorOverFireWall machine, or any other protocol type which is not allowed to run over the firewall by default, do the following:
1. Open the *.usr file, located in the script directory, using notepad and find the value for Type=.
2. On the LG machine, go to (pc install dir)\dat\mdrv\lrc_mdrv.dat file and open it in notepad
3. Add the flag "SecurityMode=on" under the relevant section like [lrc], [lrcVba], [lrcCreplay], [lrcVbareplay] etc
4. Save the changes and restart the agent process or service on the LG machine.
5. Run the test again.It work will fine
How to check the Transactions done by a Vuser in Analysis

The Analysis data pulls out the transaction data for all the vusers for your test run. If you are interested in getting data for a particular vuser then you can do that by:

Go to Transactions Summary Report, right-click on the graph and select filter.

On the filter page select VuserID filter and give a proper value or range of Vuser to get the appropriate data.

If you are not sure what is the VuserIDs during your test run then click on vusers button and it will list the VuserID used during your test

Microsoft IIS Monitoring Through LoadRunner

This Web Server Resource monitor displays statistics about the resource usage on the Microsoft Internet Information Server (IIS) during the scenario run.

To obtain data for this graph, you need to configure the MS IIS online monitor (from the Controller) and select the measurements you want to display, before running the scenario. You select measurements for the Microsoft IIS Server monitor using the MS IIS dialog box.

Note: To monitor an IIS server through a firewall, use TCP, port .

  •  Adding a Machine to Monitor on page
  • Configuring the Microsoft IIS Monitor 
  • Microsoft IIS Performance Counters 
Adding a Machine to Monitor

In order to monitor the Microsoft_IIS server from the Controller, you need  to add the machine and the measurements you want to monitor.

To add a machine to the Controller:

1. Click the MS IIS graph in the graph tree, and drag it into the right pane of the Run view.

2. Right-click the graph and select Add Measurements, or click anywhere on  the graph and choose Monitors > Add Measurements. The MS IIS dialog box opens.In the Monitored Server Machines section, click Add. The Add Machine dialog box opens.

3. Enter the server name or IP address of the machine you want to monitor.

Select the platform on which the machine runs, and click OK.

4.In the Resource Measurements on: section of the MS-IIS dialog box, the default measurements are displayed.
  •  To delete a measurement from the default list, select the measurement and click Delete.
  • To select additional measurements, click Add. A dialog box opens displaying all the available measurements.
Note: To change the default counters for the Microsoft IIS Server monitor, see “Changing a Monitor’s Default Counters”.

5.Continue with Configuring the Microsoft IIS Monitor below.

Configuring the Microsoft IIS Monitor:

After you have added the machine that you are monitoring, you configure the monitor by choosing which objects to monitor on the machine.

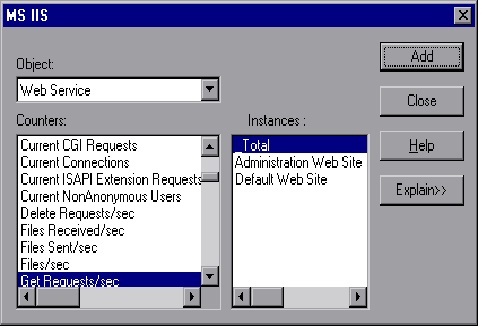
1. When you click Add to add a measurement, the MS IIS dialog box opens displaying the Web Service object, its counters, and instances opens.


For each measurement, select an object, counter, and instance, and then  click Add, as described in “Understanding the MS IIS Dialog Box” on.

Note: To change the default counters for the Microsoft IIS Server monitor,  see “Changing a Monitor’s Default Counters”.

2. Add all the desired resources to the list, and click Close.
3. Click OK in the MS IIS dialog box to activate the monitor.

Understanding the MS IIS Dialog Box

The MS IIS dialog box lets you select the items to monitor on the MS IIS  server.
  •  Object: Select the object being monitored on the specified machine.
  •  Counters: Select a resource counter to monitor. Select multiple counters using the CTRL key. For an explanation of each counter, click Explain. 
  • Instances:If multiple instances of the selected counter are running, select one or more instances to monitor for the selected counter.