What is Jmeter?Jmeter is one of the Java tools which is used to perform load testing client/server applications. It is open source software Designed to load test functional behavior and measure performance of the application.It was originally designed for testing Web Applications but has since expanded to other test functions
What are the other applications tested by Jmeter? JMeter may be used to test performance both on static and dynamic resources (files, Servlets, Perl scripts, Java Objects, Data Bases and Queries, FTP Servers and more)
What do you see when you open jmeter?By defaultTest Plan & Workbench are seen
What is Test Plan in Jmeter?Test plan describes a series of steps JMeter will execute when run.
A complete test plan will consist of one or more Thread Groups, logic conrollers, sample generating controllers, listeners, timers, assertions, and configuration elements.
What is Work bench?The Workbench is simply an area to store test elements while you are in the process of constructing a test.
The Workbench is a sandbox for any test or portion of a test that you are working on.
When you are ready to test what you have designed in the Workbench, you can copy or move the elements into the Test Plan.
It also contains Non- Test Elements
Http mirror sever
Http Proxy server {which is not available in the thread group & Test plan }
What is Thread Group?
Thread group elements are the beginning points of any test plan.
All controllers and samplers must be under a thread group.
Listeners, may be placed directly under the test plan, in which case they will apply to all the thread groups.
The controls for a thread group allow you to:
Set the number of threads
Set the ramp-up period
Set the number of times to execute the test
What are the parts of thread group?Sampler :Sends various types of requests to the server
Listeners : Results of the Run can be viewed & saved
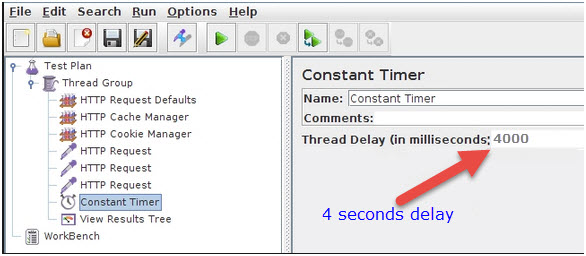
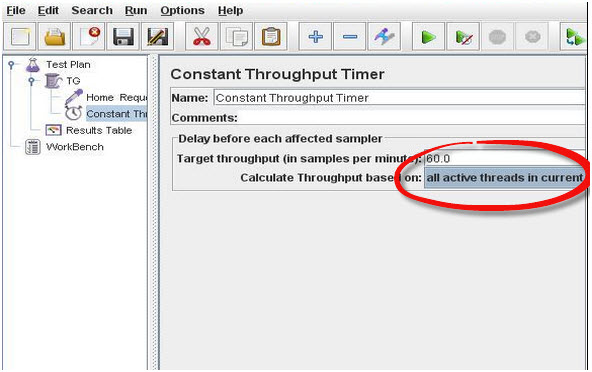
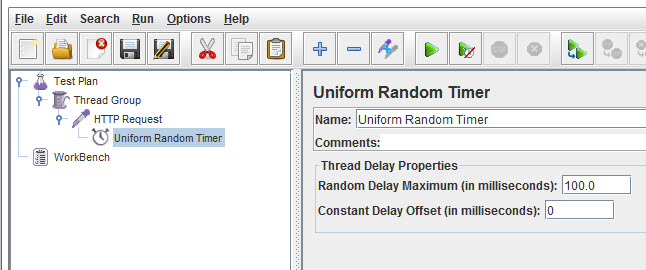
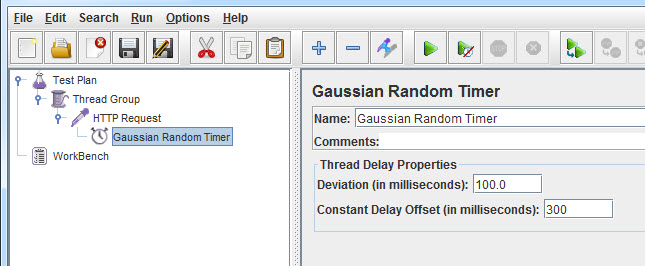
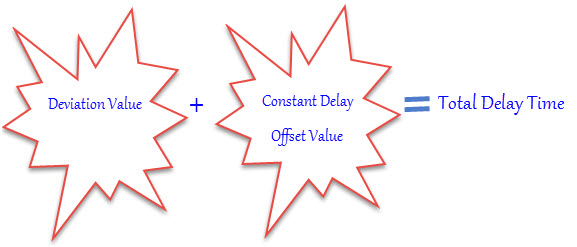
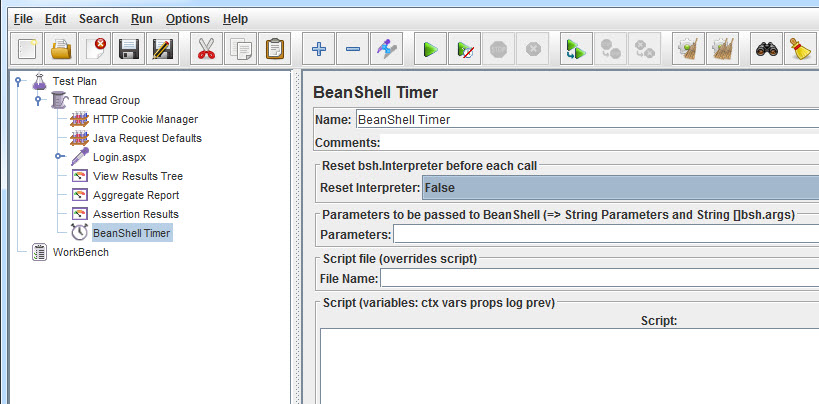
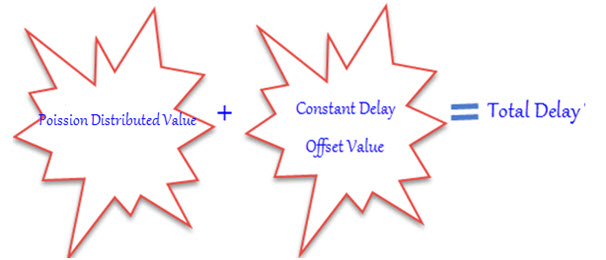
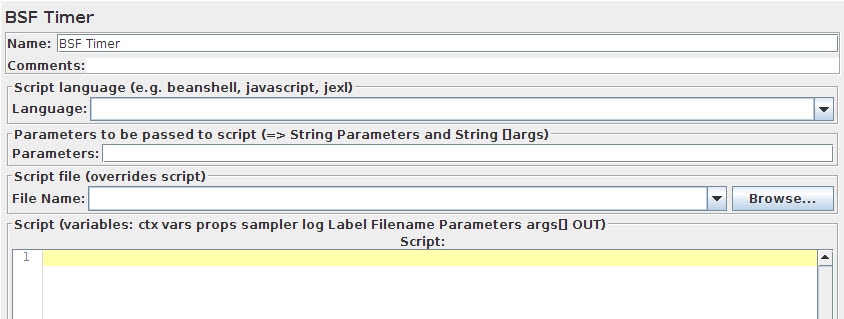
Timer : Makes th erun more realistic by inserting delays between the requests
Controller : responsible for controlling the flow of the thread group.If we have defined request to be executed on some logic like if-then-else or loop structure in java
Config Element : Info about the requests are added to work with samplers using this.
Assertion : To check if the responses are within given time and containing expected data.
What are Controllers and its types? JMeter has two types of Controllers
- Samplers Controllers
- Logical Controllers
Samplers Controllers
Samplers tell JMeter to send requests to a server.
For example, add an HTTP Request Sampler if you want JMeter to send an HTTP request. You can also customize a request by adding one or more Configuration Elements to a Sampler.
Logical Controllers
Logical Controllers let you customize the logic that JMeter uses to decide when to send requests.
Logic Controllers can change the order of requests coming from their child elements.
For example, you can add an Interleave Logic Controller to alternate between two HTTP Request Samplers.
What is Configuration element?A configuration element works closely with a Sampler
Configuration elements can be used to set up defaults and variables for later use by samplers.
Note that these elements are processed at the start of the scope in which they are found, i.e. before any samplers in the same scope.
Its elements:
CSV Data Set Config: Used to read lines from a file, and split them into variables.
HTTP Authorization Manager : You can specify one or more user logins for web pages that are restricted using server authentication
Java Request Defaults: You can set default values for Java testing
HTTP Cookie Manager: The Cookie Manager element has two functions:
It stores and sends cookies just like a web browser.
Second, you can manually add a cookie to the Cookie Manager.However, if you do this, the cookie will be shared by all JMeter threads
HTTP Request Defaults: This element lets you set default values that your HTTP Request controllers use.
HTTP Header Manager : The Header Manager lets you add or override HTTP request headers
What are Listeners?A listener is a component that shows the results of the samples .The results can be shown in a tree, tables, graphs or simply written to a log file
The Graph Results listener plots the response times on a graph.
The “View Results Tree” Listener shows details of sampler requests and responses, and can display basic HTML and XML representations of the response.Other listeners provide summary or aggregation information.
Every listener in JMeter provides a field to indicate the file to store data to.They also provide means to view, save, and read saved test results.
How did you go about fixing a performance issue?Set up JMeter to reproduce the production like scenario to put through concurrent requests and put the system under heavy load. Used a profiling tool to monitor CPU times, memory usage, etc.
What are some of your recent accomplishments?Reduced the response time from 4 seconds to 2 seconds. Set up JMeter to put the system under peak load. Used a profiling tool to monitor CPU times, memory usage, etc. Identified the bottle neck, and improved the situation by fixing the offending database connection leak, back tracking regular expression, and a badly constructed SQL query with Cartesian joins.
What are Pre-Processor and Post-Processor elements? In what order does JMeter process various type of elements?A Pre-Processor executes some action prior to a Sampler Request being made. If a Pre-Processor is attached to a Sampler element, then it will execute just prior to that sampler element running. A Pre-Processor is most often used to modify the settings of a Sample Request just before it runs, or to update variables that aren’t extracted from response text.
A Post-Processor executes some action after a Sampler Request has been made. If a Post-Processor is attached to a Sampler element, then it will execute just after that sampler element runs. A Post-Processor is most often used to process the response data, often to extract values from it.
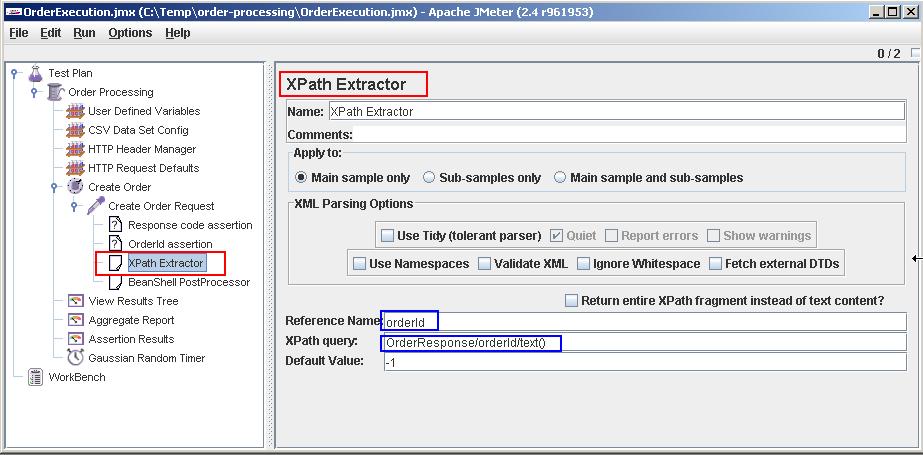
A Regular Expression Extractor can be used as a Post-Processor element to extract values to be used elsewhere in subsequent requests.
How do you ensure re-usability in your JMeter scripts?
Using config elements like “CSV Data Set Config“, “User Defined Variables“, etc for greater data reuse.
Modularizing shared tasks and invoking them via a “Module Controller“.
Writing your own BeanShell functions, and reusing them.
Does Jmeter generate any scripts? How to use the Jmeter tool and also the How to analyze the results?
When you create a test in Jmeter, save the file. The file saves with the extension .jmx.
Open the .jmx file in an editor. There you can see script.
For what purpose Jmeter used?
Jmeter is a Performance Tool. It is used to test the performance of the application. Apache JMeter is a 100% pure Java desktop application designed to load test functional behavior and measure performance. It was originally designed for testing Web Applications but has since expanded to other test functions.
Can we Parametrize via Jmeter?
Yes, you can parametrize via CSV file, User define variables or XML sheet.
How did you go about fixing a performance issue?A. Set up JMeter to reproduce the production like scenario to put through concurrent requests and put the system under heavy load. Used a profiling tool to monitor CPU times, memory usage, etc.
What are some of your recent accomplishments?A. Reduced the response time from 4 seconds to 2 seconds. Set up JMeter to put the system under peak load. Used a profiling tool to monitor CPU times, memory usage, etc. Identified the bottle neck, and improved the situation by fixing the offending database connection leak, back tracking regular expression, and a badly constructed SQL query with Cartesian joins.
What is distributed load testing? How can it be achieved in JMeter?Ans. Distributed load testing is the process using which multiple systems can be used for simulating load of large number of users. The reason of using more than one system for load testing is the limitation of single system to generate large number of threads (users).
In JMeter we can do distributed load testing using the master slave configuration.
[For complete steps to perform distributed load testing refer to the post- Distributed load testing in JMeter]
How can we reduce the resource requirement in JMeter?Ans. To make the best out of the available resources and in general as a practice, following practices should be incoroprated in the tests-
Use non-GUI mode: jmeter -n -t test.jmx -l test.jtl
Use as few Listeners as possible; if using the -l flag as above they can all be deleted or disabled.
Don't use "View Results Tree" or "View Results in Table" listeners during the load test, use them only during scripting phase to debug your scripts.
Rather than using lots of similar samplers, use the same sampler in a loop, and use variables (CSV Data Set) to vary the sample. Or perhaps use the Access Log Sampler. [The Include Controller does not help here, as it adds all the test elements in the file to the test plan.]
Don't use functional mode
Use CSV output rather than XML
Only save the data that you need
Use as few Assertions as possible
[ source: http://jmeter.apache.org/usermanual/best-practices.html]
What is Spike testing and how can we perform it in JMeter?Ans. Suddenly spiking or increasing the number of users at certain point of application and then monitoring the behavior at that intervals is spike testing.
In JMeter spike testing can be achieved using Synchronizing Timer. Synchronizing timer blocks the threads until a particular number of threads have been blocked, and then release them at once thus creating large instantaneous load.
What all activities are performed during performance testing of any application?Ans. Activities performed-
1. Create user scenarios
2. User Distribution
3. Scripting
4. Dry run of the application
5. Running a load test and analyzing the result
What is 90% line in JMeter?Ans. The aggregate report listener have 90% line as one of the metric. The Apache JMeter manual describes 90% line as- “90% of the samples took no more than this time”. It is actually the 90 percentile of the response times of the samples -
90 percentile = (90/100)*N+1/2 where N is the number of samples
So, if there are 10 samples then 90%line will be 9.5 or 9. It means the 9th value in the sorted list of samples (sorted according to ascending order of their response times) will be the 90%line value.
What is BlazeMeter?Ans. BlazeMeter is a cloud based service compatible with Apache JMeter. It generates large amount of instant load and provide very comprehensive reporting and analysis features.
In Blazemeter we can just upload the JMeter script and run the load test on cloud with predefined number of users.
What is correlation?Ans. Correlation is the most important aspect of scripting. It generally includes fetching dynamic data from preceding requests/calls and posting it to the subsequent requests.
[For more details, refer to the post- Correlation in JMeter]
Explain parameterization in JMeter?Ans. Parameterization is process of generalizing some user input, so as to use it for multiple users or executions.
What are the protocols supported by JMeter?A: The protocols supported by JMeter are:
Web: HTTP, HTTPS sites 'web 1.0' web 2.0 (ajax, flex and flex-ws-amf)
Web Services: SOAP / XML-RPC
Database via JDBC drivers
Directory: LDAP
Messaging Oriented service via JMS
Service: POP3, IMAP, SMTP
FTP Service
Q: List some of the features of JMeter.A: Following are some of the features of JMeter:
Its free. Its an open source software
It has simple and intuitive GUI.
JMeter can load and performance test many different server types: Web - HTTP, HTTPS, SOAP, Database via JDBC, LDAP, JMS, Mail - POP3
It is platform-independent tool. On Linux/Unix, JMeter can be invoked by clicking on JMeter shell script. On Windows it can be invoked by starting the jmeter.bat file.
It has full Swing and lightweight component support (precompiled JAR uses packages javax.swing.* ).
JMeter store its test plans in XML format. This means you can generate a test plan using a text editor.
It's full multi-threading framework allows concurrent sampling by many threads and simultaneous sampling of different functions by separate thread groups.
It is highly Extensible.
Can also be used to perform automated and functional testing of your application.
Q: What is a Test Plan in JMeter?A: A Test Plan defines and provides a layout of how and what to test. For example the web application as well as the client server application. It can be viewed as a container for running tests. A complete test plan will consist of one or more elements such as thread groups, logic controllers, sample-generating controllers, listeners, timers, assertions, and configuration elements. A test plan must have at least one thread group.
Q: List some of the test plan elements in JMeter.A: Following is a list of some of the test plan elements:
ThreadGroup
Controllers
Listeners
Timers
Assertions
Configuration Elements
Pre-Processor Elements
Post-Processor Elements
Q: What is Thread Group?A: Thread Group elements are the beginning points of your test plan. As the name suggests, the thread group elements control the number of threads JMeter will use during the test.
Q: What are Controllers and its types?
A: JMeter has two types of Controllers:
Samplers Controllers : Samplers allow JMeter to send specific types of requests to a server. They simulate a user's request for a page from the target server. For example, you can add a HTTP Request sampler if you need to perform a POST, GET, DELETE on a HTTP service
Logical Controllers : Logic Controllers let you control order of processing of Samplers in a Thread. Logic Controllers can change the order of request coming from any of their child elements. Some examples are: ForEach Controller, While Controller, Loop Controller, IF Controller, Run Time Controller, Interleave Controller, Throughput Controller, Run Once Controller.
Q: What is Configuration element?A: Configuration Elements allow you to create defaults and variables to be used by Samplers. They are used to add or modify requests made by Samplers.
They are executed at the start of the scope of which they are part, before any Samplers that are located in the same scope. Therefore, a Configuration Element is accessed only from inside the branch where it is placed.
Q: What are Listeners?A: Listeners let you view the results of Samplers in the form of tables, graphs, trees or simple text in some log files. They provide visual access to the data gathered by JMeter about the test cases as a Sampler component of JMeter is executed.
Listeners can be added anywhere in the test, including directly under the test plan. They will collect data only from elements at or below their level.
What are Pre-Processor and Post-Processor elements?A: A Pre-Procesor is something that will happen before a sampler executes. They are often used to modify the settings of a Sample Request just before it runs, or to update variables that are not extracted from response text.
A Post Processor executes after a sampler finishes its execution. This element is most often used to process the response data, for example, to retrieve particular value for later use.
Q: What is the execution order of Test Elements
A: Following is the execution order of the test plan elements:
Configuration elements
Pre-Processors
Timers
Sampler
Post-Processors (unless SampleResult is null)
Assertions (unless SampleResult is null)
Listeners (unless SampleResult is null)
Q: How do you ensure re-usability in your JMeter scripts?A:Using config elements like "CSV Data Set Config", "User Defined Variables", etc for greater data reuse.
Modularizing shared tasks and invoking them via a "Module Controller".
Writing your own BeanShell functions, and reusing them.
Q: Are the test plans built using JMeter OS dependant?A: Test plans are usually saved in thr XML format, hence they have nothing to do with any particular OS. You can run those test plans on any OS where JMeter can run.
Q: What are the monitor tests?A: Uses of monitor tests are:
Monitors are useful for a stress testing and system management.
Used with stress testing, the monitor provides additional information about server performance.
Monitors makes it easier to see the relationship between server performance and response time on the client side.
As a system administration tool, the monitor provides an easy way to monitor multiple servers from one console.
What are JMeter Functions?
A: JMeter functions are special values that can populate fields of any Sampler or other element in a test tree. A function call looks like this:${__functionName(var1,var2,var3)}
Q: Where can functions and variables be used?A: Functions and variables can be written into any field of any test component.
Q: What are regular expressions in JMeter?A: Regular expressions are used to search and manipulate text, based on patterns. JMeter interprets forms of regular expressions or patterns being used throughout a JMeter test plan, by including the pattern matching software Apache Jakarta ORO.
Q: How can you reduce resource requirements in JMeter?A: Below are some suggestion to reduce resource requirements:
Use non-GUI mode: jmeter -n -t test.jmx -l test.jtl.
Use as few Listeners as possible; if using the -l flag as above they can all be deleted or disabled.
Disable the “View Result Tree” listener as it consumes a lot of memory and can result in the console freezing or JMeter running out of memory. It is, however, safe to use the “View Result Tree” listener with only “Errors” checked.
Rather than using lots of similar samplers, use the same sampler in a loop, and use variables (CSV Data Set) to vary the sample. Or perhaps use the Access Log Sampler.
Don't use functional mode.
Use CSV output rather than XML.
Only save the data that you need.
Use as few Assertions as possible.
Disable all JMeter graphs as they consume a lot of memory. You can view all of the real time graphs using the JTLs tab in your web interface.
Do not forget to erase the local path from CSV Data Set Config if used.
Clean the Files tab prior to every test run.